GDB, the GNU Debugger, was among the first programs to be written for the Free Software Foundation, and it has been a staple of free and open source software systems ever since. Originally designed as a plain Unix source-level debugger, it has since been expanded to a wide range of uses, including use with many embedded systems, and has grown from a few thousand lines of C to over half a million.
This chapter will delve into the overall internal structure of GDB, showing how it has gradually developed as new user needs and new features have come in over time.
GDB is designed to be a symbolic debugger for programs written in compiled imperative languages such as C, C++, Ada, and Fortran. Using its original command-line interface, a typical usage looks something like this:
% gdb myprog
[...]
(gdb) break buggy_function
Breakpoint 1 at 0x12345678: file myprog.c, line 232.
(gdb) run 45 92
Starting program: myprog
Breakpoint 1, buggy_function (arg1=45, arg2=92) at myprog.c:232
232     result = positive_variable * arg1 + arg2;
(gdb) print positive_variable
$$1 = -34
(gdb)
GDB shows something that is not right, the developer says "aha" or "hmmm", and then has to decide both what the mistake is and how to fix it.
The important point for design is that a tool like GDB is basically an interactive toolbox for poking around in a program, and as such it needs to be responsive to an unpredictable series of requests. In addition, it will be used with programs that have been optimized by the compiler, and programs that exploit every hardware option for performance, so it needs to have detailed knowledge down to the lowest levels of a system.
GDB also needs to be able to debug programs compiled by different compilers (not just the GNU C compiler), to debug programs compiled years earlier by long-obsolete versions of compilers, and to debug programs whose symbolic info is missing, out of date, or simply incorrect; so, another design consideration is that GDB should continue to work and be useful even if data about the program is missing, or corrupted, or simply incomprehensible.
The following sections assume a passing familiarity with using GDB from the command line. If you're new to GDB, give it a try and peruse the manual.[SPS+00]
GDB is an old program. It came into existence around 1985, written by Richard Stallman along with GCC, GNU Emacs, and other early components of GNU. (In those days, there were no public source control repositories, and much of the detailed development history is now lost.)
The earliest readily available releases are from 1988, and comparison with present-day sources shows that only a handful of lines bear much resemblance; nearly all of GDB has been rewritten at least once. Another striking thing about early versions of GDB is that the original goals were rather modest, and much of the work since then has been extension of GDB into environments and usages that were not part of the original plan.
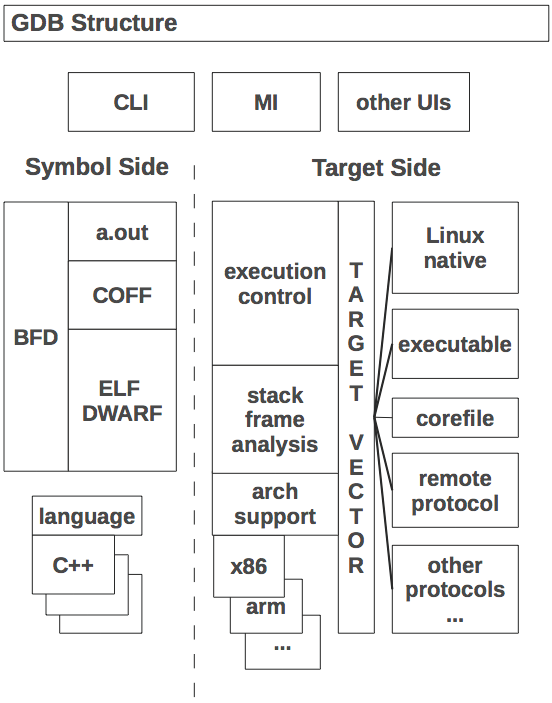
At the largest scale, GDB can be said to have two sides to it:
ptrace that gives one process the ability to read and write the
state of a different process. Thus, GDB's target side is
mostly about making ptrace calls and interpreting the results.
For cross-debugging an embedded system, however, the target side constructs
message packets to send over a wire, and waits for response packets in
return.
The two sides are somewhat independent of each other; you can look around your program's code, display variable types, etc., without actually running the program. Conversely, it is possible to do pure machine-language debugging even if no symbols are available.
In the middle, tying the two sides together, is the command interpreter and the main execution control loop.
To take a simple case of how it all ties together, consider the print
command from above. The command interpreter finds the print command
function, which parses the expression into a simple tree structure and
then evaluates it by walking the tree. At some point the evaluator
will consult the symbol table to find out that
positive_variable is an integer global variable that is stored
at, say, memory address 0x601028. It then calls a target-side
function to read the four bytes of memory at that address, and hands
the bytes to a formatting function that displays them as a decimal
number.
To display source code and its compiled version, GDB does a
combination of reads from the source file and the target system, then
uses compiler-generated line number information to connect the two.
In the example here, line 232 has the address 0x4004be, line
233 is at 0x4004ce, and so on.
[...]
232  result = positive_variable * arg1 + arg2;
0x4004be <+10>:  mov  0x200b64(%rip),%eax  # 0x601028 <positive_variable>
0x4004c4 <+16>:  imul -0x14(%rbp),%eax
0x4004c8 <+20>:  add  -0x18(%rbp),%eax
0x4004cb <+23>:  mov  %eax,-0x4(%rbp)

233  return result;
0x4004ce <+26>:  mov  -0x4(%rbp),%eax
[...]
The single-stepping command step conceals a complicated dance
going on behind the scenes. When the user asks to step to the next
line in the program, the target side is asked to execute only a single
instruction of the program and then stop it again (this is one of the
things that ptrace can do). Upon being informed that the
program has stopped, GDB asks for the program counter (PC) register
(another target side operation) and then compares it with the range of
addresses that the symbol side says is associated with the current
line. If the PC is outside that range, then GDB leaves the program
stopped, figures out the new source line, and reports that to the
user. If the PC is still in the range of the current line, then GDB
steps by another instruction and checks again, repeating until the PC
gets to a different line. This basic algorithm has the advantage that
it always does the right thing, whether the line has jumps, subroutine
calls, etc., and does not require GDB to interpret all the details of
the machine's instruction set. A disadvantage is that there are many
interactions with the target for each single-step which, for some
embedded targets, results in noticeably slow stepping.
As a program needing extensive access all the way down to the physical registers on a chip, GDB was designed from the beginning to be portable across a variety of systems. However, its portability strategy has changed considerably over the years.
Originally, GDB started out similar to the other GNU programs of the
time; coded in a minimal common subset of C, and using a combination
of preprocessor macros and Makefile fragments to adapt to a specific
architecture and operating system. Although the stated goal of the
GNU project was a self-contained "GNU operating system",
bootstrapping would have to be done on a variety of existing systems;
the Linux kernel was still years in the future. The configure
shell script is the first key step of the process. It can do a
variety of things, such as making a symbolic link from a
system-specific file to a generic header name, or constructing files
from pieces, more importantly the Makefile used to build the program.
Programs like GCC and GDB have additional portability needs over
something like cat or diff, and over time, GDB's
portability bits came to be separated into three classes, each with
its own Makefile fragment and header file.
configure run
little test programs, using the same compiler that was going to be
used to build the tool. This is what
autoconf[aut12] is all about, and today nearly all
GNU tools and many (if not most) Unix programs use
autoconf-generated configure scripts.
ptrace (which vary considerably between flavors of Unix), how
to find shared libraries that have been loaded, and so forth, which
only apply to the native debugging case. Native definitions are a
last holdout of 1980s-style macros, although most are now figured out
using autoconf.
Before drilling down into the parts of GDB, let's take a look at the
major data structures that GDB works with. As GDB is a C program,
these are implemented as structs rather than as C++-style
objects, but in most cases they are treated as objects, and here we
follow GDBers' frequent practice in calling them objects.
A breakpoint is the main kind of object that is directly accessible to
the user. The user creates a breakpoint with the break
command, whose argument specifies a location, which can be a
function name, a source line number, or a machine address. GDB
assigns a small positive integer to the breakpoint object, which the
user subsequently uses to operate on the breakpoint. Within GDB, the
breakpoint is a C struct with a number of fields. The location gets
translated to a machine address, but is also saved in its original
form, since the address may change and need recomputation, for
instance if the program is recompiled and reloaded into a session.
Several kinds of breakpoint-like objects actually share the breakpoint
struct, including watchpoints, catchpoints, and tracepoints. This
helps ensure that creation, manipulation, and deletion facilities are
consistently available.
The term "location" also refers to the memory addresses at which the breakpoint is to be installed. In the cases of inline functions and C++ templates, it may be that a single user-specified breakpoint may correspond to several addresses; for instance, each inlined copy of a function entails a separate location for a breakpoint that is set on a source line in the function's body.
Symbol tables are a key data structure to GDB, and can be quite large, sometimes growing to occupy multiple gigabytes of RAM. To some extent, this is unavoidable; a large application in C++ can have millions of symbols in its own right, and it pulls in system header files which can have millions more symbols. Each local variable, each named type, each value of an enum—all of these are separate symbols.
GDB uses a number of tricks to reduce symbol table space, such as
partial symbol tables (more about those later), bit fields in structs,
etc.
In addition to symbol tables that basically map character strings to address and type information, GDB builds line tables that support lookup in two directions; from source lines to addresses, and then from addresses back to source lines. (For instance, the single-stepping algorithm described earlier crucially depends on the address-to-source mapping.)
The procedural languages for which GDB was designed share a common runtime architecture, in that function calls cause the program counter to be pushed on a stack, along with some combination of function arguments and local arguments. The assemblage is called a stack frame, or "frame" for short, and at any moment in a program's execution, the stack consists of a sequence of frames chained together. The details of a stack frame vary radically from one chip architecture to the next, and is also dependent on the operating system, compiler, and optimization options.
A port of GDB to a new chip may need a considerable volume of code to analyze the stack, as programs (especially buggy ones, which are the ones debugger users are mostly interested in) can stop anywhere, with frames possibly incomplete, or partly overwritten by the program. Worse, constructing a stack frame for each function call slows down the application, and a good optimizing compiler will take every opportunity to simplify stack frames, or even eliminate them altogether, such as for tail calls.
The result of GDB's chip-specific stack analysis is recorded in a series of frame objects. Originally GDB kept track of frames by using the literal value of a fixed-frame pointer register. This approach breaks down for inlined function calls and other kinds of compiler optimizations, and starting in 2002, GDBers introduced explicit frame objects that recorded what had been figured out about each frame, and were linked together, mirroring the program's stack frames.
As with stack frames, GDB assumes a degree of commonality among the expressions of the various languages it supports, and represents them all as a tree structure built out of node objects. The set of node types is effectively a union of all the types of expressions possible in all the different languages; unlike in the compiler, there is no reason to prevent the user from trying to subtract a Fortran variable from a C variable—perhaps the difference of the two is an obvious power of two, and that gives us the "aha" moment.
The result of evaluation may itself be more complex than an integer or
memory address, and GDB also retains evaluation results in a numbered
history list, which can then be referred to in later expressions. To
make all this work, GDB has a data structure for values. Value
structs have a number of fields recording various properties;
important ones include an indication of whether the value is an
r-value or l-value (l-values can be assigned to, as in C), and whether
the value is to be constructed lazily.
The symbol side of GDB is mainly responsible for reading the executable file, extracting any symbolic information it finds, and building it into a symbol table.
The reading process starts with the BFD library. BFD is a sort of
universal library for handling binary and object files; running on any
host, it can read and write the original Unix a.out format,
COFF (used on System V Unix and MS Windows), ELF (modern Unix,
GNU/Linux, and most embedded systems), and some other file formats.
Internally, the library has a complicated structure of C macros that
expand into code incorporating the arcane details of object file
formats for dozens of different systems. Introduced in 1990, BFD is
also used by the GNU assembler and linker, and its ability to produce
object files for any target is key to cross-development using GNU
tools. (Porting BFD is also a key first step in porting the tools to a
new target.)
GDB only uses BFD to read files, using it to pull blocks of data from the executable file into GDB's memory. GDB then has two levels of reader functions of its own. The first level is for basic symbols, or "minimal symbols", which are just the names that the linker needs to do its work. These are strings with addresses and not much else; we assume that addresses in text sections are functions, addresses in data sections are data, and so forth.
The second level is detailed symbolic information, which typically has
its own format different from the basic executable file format; for
instance, information in the DWARF debug format is contained in
specially named sections of an ELF file. By contrast, the old
stabs debug format of Berkeley Unix used specially flagged
symbols stored in the general symbol table.
The code for reading symbolic information is somewhat tedious, as the different symbolic formats encode every kind of type information that could be in a source program, but each goes about it in its own idiosyncratic way. A GDB reader just walks through the format, constructing GDB symbols that we think correspond to what the symbolic format intends.
For a program of significant size (such as Emacs or Firefox), construction of the symbol table can take quite a while, maybe even several minutes. Measurements consistently show that the time is not in file reading as one might expect, but in the in-memory construction of GDB symbols. There are literally millions of small interconnected objects involved, and the time adds up.
Most of the symbolic information will never be looked at in a session, since it is local to functions that the user may never examine. So, when GDB first pulls in a program's symbols, it does a cursory scan through the symbolic information, looking for just the globally visible symbols and recording only them in the symbol table. Complete symbolic info for a function or method is filled in only if the user stops inside it.
Partial symbol tables allow GDB to start up in only a few seconds, even for large programs. (Shared library symbols are also dynamically loaded, but the process is rather different. Typically GDB uses a system-specific technique to be notified when the library is loaded, then builds a symbol table with functions at the addresses that were decided on by the dynamic linker.)
Source language support mainly consists of expression parsing and value printing. The details of expression parsing are left up to each language, but in the general the parser is based on a Yacc grammar fed by a hand-crafted lexical analyzer. In keeping with GDB's goal of providing more flexibility to the interactive user, the parser is not expected to be especially stringent; for instance, if it can guess at a reasonable type for an expression, it will simply assume that type, rather than require the user to add a cast or type conversion.
Since the parser need not handle statements or type declarations, it is much simpler than the full language parser. Similarly, for printing, there are just a handful of types of values that need to be displayed, and oftentimes the language-specific print function can call out to generic code to finish the job.
The target side is all about manipulation of program execution and raw data. In a sense, the target side is a complete low-level debugger; if you are content to step by instructions and dump raw memory, you can use GDB without needing any symbols at all. (You may end up operating in this mode anyway, if the program happens to stop in a library whose symbols have been stripped out.)
Originally the target side of GDB was composed of a handful of
platform-specific files that handled the details of calling
ptrace, launching executables, and so on. This is not sufficiently flexible for long-running debugging sessions,
in which the user might switch from local to remote debugging, switch
from files to core dumps to live programs, attach and detach, etc., so in 1990 John Gilmore redesigned the target side of GDB to send all
target-specific operations through the target vector, which is
basically a class of objects, each of which defines the the specifics
of a type of target system. Each target vector is implemented as a
structure of several dozen function pointers (often called
"methods"), whose purposes range from the reading and writing of
memory and registers, to resuming program execution, to setting
parameters for the handling of shared libraries. There are about 40
target vectors in GDB, ranging from the well-used target vector for
Linux to obscure vectors such as the one that operates a Xilinx
MicroBlaze. Core dump support uses a target vector that gets data by
reading a corefile, and there is another target vector that reads data
from the executable.
It is often useful to blend methods from several target vectors.
Consider the printing of an initialized global variable on Unix;
before the program starts running, printing the variable should work,
but at that point there is no process to read, and bytes need to come
from the executable's .data section. So, GDB uses the target
vector for executables and reads from the binary file. But while the
program is running, the bytes should instead come from the process's
address space. So, GDB has a "target stack" where the target vector
for live processes is pushed on top of the executable's target vector
when the process starts running, and is popped when it exits.
In reality, the target stack turns out not to be quite as stack-like as one might think. Target vectors are not really orthogonal to each other; if you have both an executable and a live process in the session, while it makes sense to have the live process's methods override the executable's methods, it almost never makes sense to do the reverse. So GDB has ended up with a notion of a stratum in which "process-like" target vectors are all at one stratum, while "file-like" target vectors get assigned to a lower stratum, and target vectors can get inserted as well as pushed and popped.
(Although GDB maintainers don't like the target stack much, no one has proposed—or prototyped—any better alternative.)
As a program that works directly with the instructions of a CPU, GDB needs in-depth knowledge about the details of the chip. It needs to know about all the registers, the sizes of the different kinds of data, the size and shape of the address space, how the calling convention works, what instruction will cause a trap exception, and so on. GDB's code for all this typically ranges from 1,000 to over 10,000 lines of C, depending on the architecture's complexity.
Originally this was handled using target-specific preprocessor macros, but as the debugger became more sophisticated, these got larger and larger, and over time long macro definitions were made into regular C functions called from the macros. While this helped, it did not help much with architectural variants (ARM vs. Thumb, 32-bit vs. 64-bit versions of MIPS or x86, etc.), and worse, multiple-architecture designs were on the horizon, for which macros would not work at all. In 1995, I proposed solving this with an object-based design, and starting in 1998 Cygnus Solutions funded Andrew Cagney to start the changeover. (Cygnus Solutions was a company founded in 1989 to provide commercial support for free software, acquired in 2000 by Red Hat.) It took several years and contributions from dozens of hackers to finish the job, affecting perhaps 80,000 lines of code in all.
The introduced constructs are called gdbarch objects, and at
this point may contain as many as 130 methods and variables defining a
target architecture, although a simple target might only need a dozen
or so of these.
To get a sense of how the old and new ways compare, see the
declaration that x86 long doubles are 96 bits in size from
gdb/config/i386/tm-i386.h, circa 2002:
#define TARGET_LONG_DOUBLE_BIT 96
and from gdb/i386-tdep.c, in 2012:
i386_gdbarch_init( [...] )
{
  [...]

  set_gdbarch_long_double_bit (gdbarch, 96);

  [...]
}
The heart of GDB is its execution control loop. We touched on it
earlier when describing single-stepping over a line; the algorithm
entailed looping over multiple instructions until finding one
associated with a different source line. The loop is called wait_for_inferior, or "wfi" for short.
Conceptually it is inside the main command loop, and is only entered
for commands that cause the program to resume execution. When the
user types continue or step and then waits while nothing
seems to be happening, GDB may in fact be quite busy. In addition to
the single-stepping loop mentioned above, the program may be hitting
trap instructions and reporting the exception to GDB. If the
exception is due to the trap being a breakpoint inserted by GDB, it
then tests the breakpoint's condition, and if false, it removes the
trap, single-steps the original instruction, re-inserts the trap, and
then lets the program resume. Similarly, if a signal is raised, GDB
may choose to ignore it, or handle it one of several ways specified in
advance.
All of this activity is managed by wait_for_inferior.
Originally this was a simple loop, waiting for the target to stop and
then deciding what to do about it, but as ports to various systems
needed special handling, it grew to a thousand lines, with goto
statements criss-crossing it for poorly understood reasons. For
instance, with the proliferation of Unix variants, there was no one
person who understood all their fine points, nor did we have access to
all of them for regression testing, so there was a strong incentive to
modify the code in a way that exactly preserved behavior for existing
ports—and a goto skipping over part of the loop was an all-too-easy
tactic.
The single big loop was also a problem for any kind of asynchronous handling or debugging of threaded programs, in which the user wants to start and stop a single thread while allowing the rest of the program to continue running.
The conversion to an event-oriented model took several years. I broke
up wait_for_inferior in 1999, introducing an execution
control state structure to replace the pile of local and global
variables, and converting the tangle of jumps into smaller independent
functions. At the same time Elena Zannoni and others introduced event
queues that included both input from the user and notifications from
the inferior.
Although GDB's target vector architecture allows for a broad variety of ways to control a program running on a different computer, we have a single preferred protocol. It does not have a distinguishing name, and is typically called just the "remote protocol", "GDB remote protocol", "remote serial protocol" (abbreviating to "RSP"), "remote.c protocol" (after the source file that implements it), or sometimes the "stub protocol", referring to the target's implementation of the protocol.
The basic protocol is simple, reflecting the desire to have it work on
small embedded systems of the 1980s, whose memories were measured in
kilobytes. For instance, the protocol packet $g requests all
registers, and expects a reply consisting of all the bytes of all the
registers, all run together—the assumption being that their number,
size, and order will match what GDB knows about.
The protocol expects a single reply to each packet sent, and assumes
the connection is reliable, adding only a checksum to packets sent
(so $g is really sent as $g#67 over the wire).
Although there are only a handful of required packet types (corresponding to the half-dozen target vector methods that are most important), scores of additional optional packets have been added over the years, to support everything from hardware breakpoints, to tracepoints, to shared libraries.
On the target itself, the implementation of the remote protocol can take a wide variety of forms. The protocol is fully documented in the GDB manual, which means that it is possible to write an implementation that is not encumbered with a GNU license, and indeed many equipment manufacturers have incorporated code that speaks the GDB remote protocol, both in the lab and in the field. Cisco's IOS, which runs much of their networking equipment, is one well-known example.
A target's implementation of the protocol is often referred to as a "debugging stub", or just "stub", connoting that it is not expected to do very much work on its own. The GDB sources include a few example stubs, which are typically about 1,000 lines of low-level C. On a totally bare board with no OS, the stub must install its own handlers for hardware exceptions, most importantly to catch trap instructions. It will also need serial driver code if the hardware link is a serial line. The actual protocol handling is simple, since all the required packets are single characters that can be decoded with a switch statement.
Another approach to remote protocol is to build a "sprite" that interfaces between GDB and dedicated debugging hardware, including JTAG devices, "wigglers", etc. Oftentimes these devices have a library that must run on the computer that is physically connected to a target board, and often the library API is not architecturally compatible with GDB's internals. So, while configurations of GDB have called hardware control libraries directly, it has proven simpler to run the sprite as an independent program that understands remote protocol and translates the packets into device library calls.
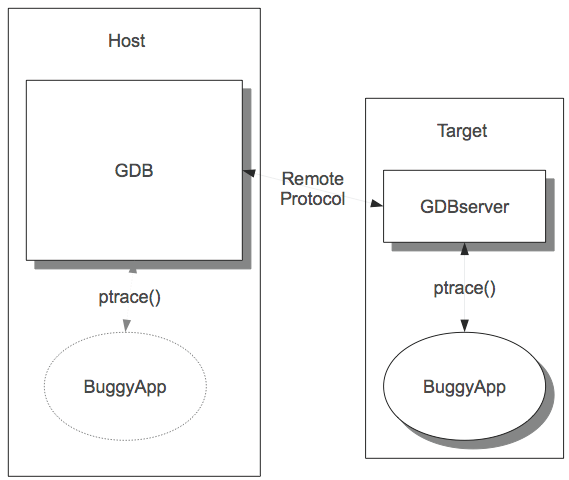
The GDB sources do include one complete and working implementation of the target side of the remote protocol: GDBserver. GDBserver is a native program that runs under the target's operating system, and controls other programs on the target OS using its native debugging support, in response to packets received via remote protocol. In other words, it acts as a sort of proxy for native debugging.
GDBserver doesn't do anything that native GDB can't do; if your target system can run GDBserver, then theoretically it can run GDB. However, GDBserver is 10 times smaller and doesn't need to manage symbol tables, so it is very convenient for embedded GNU/Linux usages and the like.
GDB and GDBserver share some code, but while it is an obvious idea to encapsulate OS-specific process control, there are practical difficulties with separating out tacit dependencies in native GDB, and the transition has gone slowly.
GDB is fundamentally a command-line debugger. Over time people have tried various schemes to make it into a graphical windowed debugger but, despite all the time and effort, none of these are universally accepted.
The command-line interface uses the standard GNU library
readline to handle the character-by-character interaction with
the user. Readline takes care of things like line editing and command
completion; the user can do things like use cursor keys to go back in
a line and fix a character.
GDB then takes the command returned by readline and looks it up
using a cascaded structure of command tables, where each successive
word of the command selects an additional table. For instance
set print elements 80 involves three tables; the first is the
table of all commands, the second is a table of options that can be
set, and the third is a table of value printing options, of
which elements is the one that limits the number of objects
printed from an aggregate like a string or array. Once the cascaded
tables have called an actual command-handling function, it takes
control, and argument parsing is completely up to the function. Some
commands, such as run, handle their arguments similarly to
traditional C argc/argv standards, while others, such as
print, assume that the remainder of the line is a single
programming language expression, and give the entire line over to a
language-specific parser.
One way to provide a debugging GUI is to use GDB as a sort of "backend" to a graphical interface program, translating mouse clicks into commands and formatting print results into windows. This has been made to work several times, including KDbg and DDD (Data Display Debugger), but it's not the ideal approach because sometimes results are formatted for human readability, omitting details and relying on human ability to supply context.
To solve this problem, GDB has an alternate "user" interface, known as the Machine Interface or MI for short. It is still fundamentally a command-line interface, but both commands and results have additional syntax that makes everything explicit—each argument is bounded by quotes, and complex output has delimiters for subgroups and parameter names for component pieces. In addition, MI commands can be prefixed with sequence identifiers that are echoed back in results, ensuring reported results are matched up with the right commands.
To see how the two forms compare, here is a normal step command and GDB's response:
(gdb) step

buggy_function (arg1=45, arg2=92) at ex.c:232
232  result = positive_variable * arg1 + arg2;
With the MI, the input and output are more verbose, but easier for other software to parse accurately:
4321-exec-step

4321^done,reason="end-stepping-range",
      frame={addr="0x00000000004004be",
             func="buggy_function",
             args=[{name="arg1",value="45"},
                   {name="arg2",value="92"}],
             file="ex.c",
             fullname="/home/sshebs/ex.c",
             line="232"}
The Eclipse[ecl12] development environment is the most notable client of the MI.
Additional frontends include a tcl/tk-based version called GDBtk or Insight, and a curses-based interface called the TUI, originally contributed by Hewlett-Packard. GDBtk is a conventional multi-paned graphical interface built using the tk library, while the TUI is a split-screen interface.
As an original GNU program, GDB development started out following the "cathedral" model of development. Originally written by Stallman, GDB then went through a succession of "maintainers", each of whom was a combination of architect, patch reviewer, and release manager, with access to the source repository limited to a handful of Cygnus employees.
In 1999, GDB migrated to a public source repository and expanded to a team of several dozen maintainers, aided by scores of individuals with commit privileges. This has accelerated development considerably, with the 10-odd commits each week growing to 100 or more.
As GDB is highly system-specific, has a great many ports to systems ranging from the smallest to the largest in computerdom, and has hundreds of commands, options, and usage styles, it is difficult for even an experienced GDB hacker to anticipate all the effects of a change.
This is where the test suite comes in. The test suite consists of a
number of test programs combined with expect scripts, using a
tcl-based testing framework called DejaGNU. The basic model is that
each script drives GDB as it debugs a test program, sending commands and
then pattern-matching the output against regular expressions.
The test suite also has the ability to run cross-debugging to both live hardware and simulators, and to have tests that are specific to a single architecture or configuration.
At the end of 2011, the test suite includes some 18,000 test cases, which include tests of basic functionality, language-specific tests, architecture-specific tests, and MI tests. Most of these are generic and are run for any configuration. GDB contributors are expected to run the test suite on patched sources and observe no regressions, and new tests are expected to accompany each new feature. However, as no one has access to all platforms that might be affected by a change, it is rare to get all the way to zero failures; 10--20 failures is usually reasonable for a trunk snapshot configured for native debugging, and some embedded targets will have more failures.
GDB started out as an exemplar of the "cathedral" development process, in which the maintainer keeps close control of the sources, with the outside world only seeing progress via periodic snapshots. This was rationalized by the relative infrequence of patch submissions, but the closed process was actually discouraging patches. Since the open process has been adopted, the number of patches is much larger than ever before, and quality is just as good or better.
The open source development process is intrinsically somewhat chaotic, as different individuals work on the code for a while, then fall away, leaving others to continue on.
However, it still makes sense to make a development plan and publish it. It helps guide developers as they work on related tasks, it can be shown to potential funders, and it lets volunteers think about what they can do to advance it.
But don't try to force dates or time frames; even if everyone is enthusiastic about a direction, it is unlikely that people can guarantee full-time effort for long enough to finish by a chosen date.
For that matter, don't cling to the plan itself if it has become
outdated. For a long time, GDB had a plan to restructure as a library,
libgdb, with a well-defined API, that could be linked into other
programs (in particular ones with GUIs); the build process was
even changed to build a libgdb.a as an intermediate step.
Although the idea has come up periodically since then, the primacy of
Eclipse and MI meant that the library's main rationale has been
sidestepped, and as of January 2012 we have abandoned the library
concept and are expunging the now-pointless bits of code.
After seeing some of the changes we made, you might be thinking: Why didn't we do things right in the first place? Well, we just weren't smart enough.
Certainly we could have anticipated that GDB was going to be tremendously popular, and was going to be ported to dozens and dozens of architectures, both native and cross. If we had known that, we could have started with the gdbarch objects, instead of spending years upgrading old macros and global variables; ditto for the target vector.
Certainly we could have anticipated GDB was going to be used with GUIs. After all in 1986 both the Mac and the X Window System had already been out for two years! Instead of designing a traditional command interface, we could have set it up to handle events asynchronously.
The real lesson though is that not that GDBers were dumb, but that we couldn't possibly have been smart enough to anticipate how GDB would need to evolve. In 1986 it was not at all clear that the windows-and-mouse interface was going to become ubiquitous; if the first version of GDB was perfectly adapted for GUI use, we'd have looked like geniuses, but it would have been sheer luck. Instead, by making GDB useful in a more limited scope, we built a user base that enabled more extensive development and re-engineering later.
Try to complete transitions, but they may take a while; expect to live with them being incomplete.
At the GCC Summit in 2003, Zack Weinberg lamented the "incomplete transitions" in GCC, where new infrastructure had been introduced, but the old infrastructure could not be removed. GDB has these also, but we can point to a number of transitions that have been completed, such as the target vector and gdbarch. Even so, they can take a number of years to complete, and in the meantime one has to keep the debugger running.
When you spend a long time with a single body of code, and it's an important program that also pays the bills, it's easy to get attached to it, and even to mold your thinking to fit the code, rather than the other way around.
Don't.
Everything in the code originated with a series of conscious decisions: some inspired, some less so. The clever space-saving trick of 1991 is a pointless complexity with the multi-gigabyte RAMs of 2011.
GDB once supported the Gould supercomputer. When they turned off the last machine, around 2000, there really wasn't any point in keeping those bits around. That episode was the genesis of an obsoletion process for GDB, and most releases now include the retirement of some piece or another.
In fact, there are a number of radical changes on the table or already underway, ranging from the adoption of Python for scripting, to support for debugging of highly parallel multicore systems, to recoding into C++. The changes may take years to complete; all the more reason to get started on them now.